Temperature Profile Monitoring for Coral Bleaching Early Warning
Track vertical temperature gradients to predict thermal stress before bleaching occurs and guide intervention decisions.

What You'll Achieve
Predict Bleaching Events Before Visible Stress
Detect thermal stress accumulation days to weeks before bleaching becomes visible, enabling proactive intervention rather than reactive damage assessment.
Guide Targeted Protection and Restoration Efforts
Identify which reef zones face greatest thermal stress to prioritize shading interventions, coral relocation, or enhanced monitoring during heat events.
Document Recovery Trajectories for Long-Term Management
Establish the continuous temperature record needed to demonstrate restoration success, justify adaptive management decisions, and secure ongoing funding.
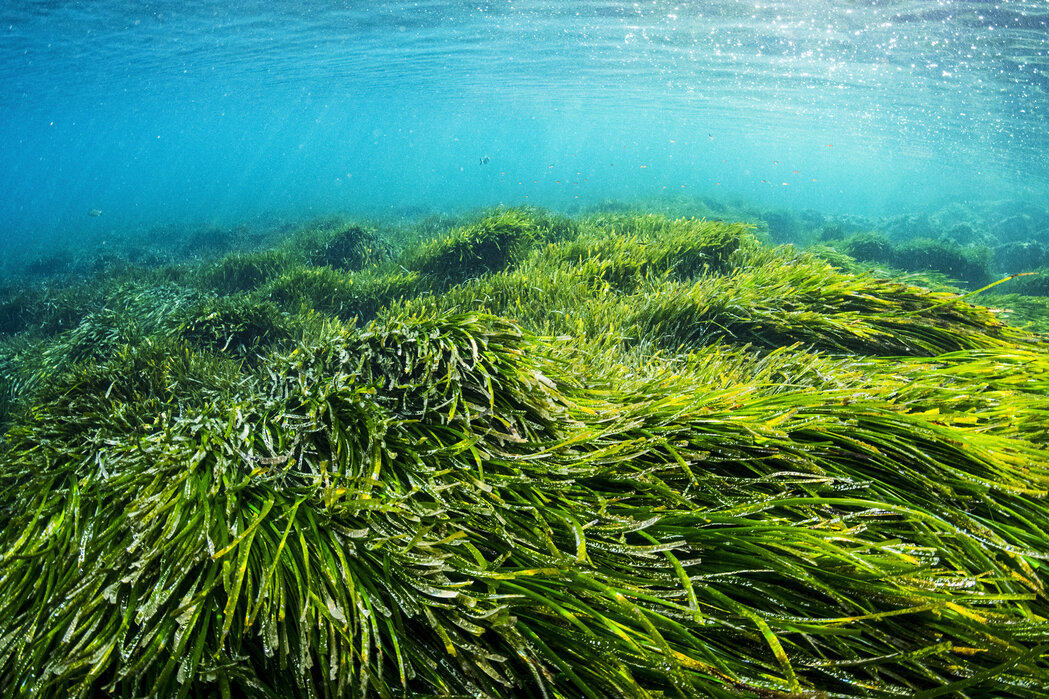
Thermal Stress Builds Vertically Before It Shows Visually
Coral bleaching doesn't announce itself until the damage is already underway. By the time colonies turn white, they've endured days or weeks of accumulated thermal stress — and the window for protective intervention has closed. The challenge isn't just detecting high temperatures; it's understanding how heat distributes through the water column, because thermal stratification determines which reef zones bleach first[1] and which might serve as refugia.
Traditional monitoring approaches — monthly dive surveys or single-point temperature loggers — miss the vertical temperature gradients that drive differential bleaching across depth zones. Without continuous vertical profiles, managers can't predict which reef areas face greatest risk during marine heat waves, can't time interventions before stress becomes lethal, and lack the high-resolution data needed to demonstrate that restoration investments are creating measurable thermal resilience.
Continuous Vertical Temperature Profiling Reveals Thermal Stress Before Bleaching Appears
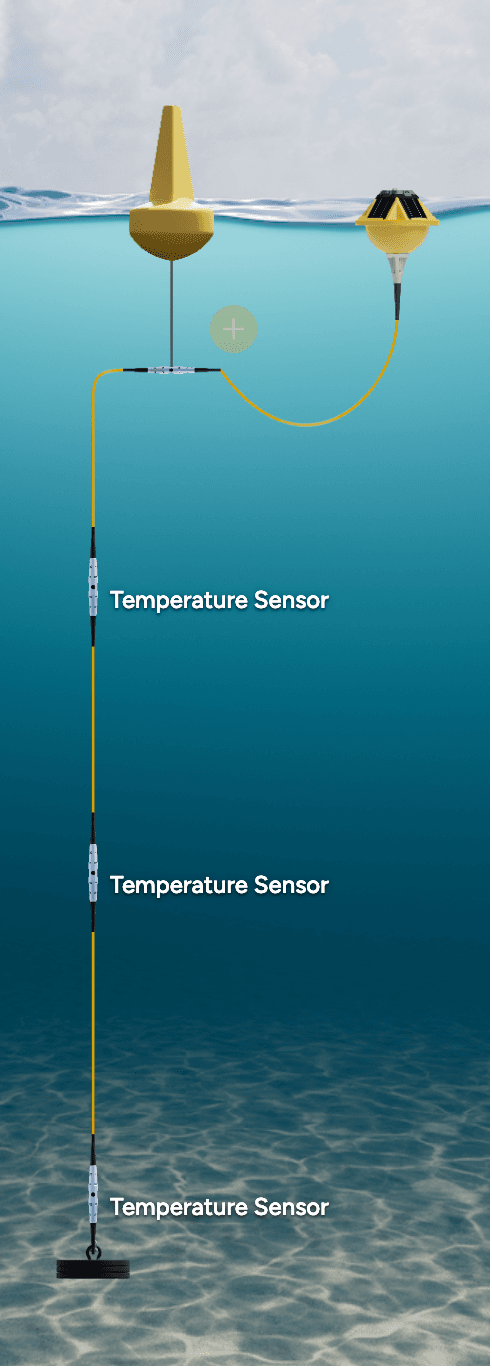
What Gets Deployed
A network of sensor systems captures temperature at multiple depths across the reef, from shallow crest to deeper slope, establishing the vertical temperature structure that determines bleaching risk. Each system measures conditions at its depth zone continuously, creating the spatial coverage needed to track how thermal stress accumulates differently across the reef profile. For larger reef systems or sites with complex bathymetry, multiple stations positioned across depth gradients provide the spatial resolution needed to detect thermal refugia and predict differential bleaching patterns.
What the Data Reveals
Because the network captures temperature continuously at multiple depths, teams see how thermal stratification develops during calm periods and breaks down during mixing events. When surface waters heat rapidly but deeper zones remain cooler, the data reveals potential thermal refugia where corals experience lower cumulative stress. As Degree Heating Weeks accumulate differently across depth zones[2], managers can predict which reef areas will bleach first — shallow crests typically cross the 4°C-week threshold days before deeper slopes.
Over weeks and months, these observations reveal whether the reef experiences brief thermal spikes that corals can tolerate or sustained stress that triggers bleaching. When conditions approach the bleaching threshold — typically 1°C above the maximum monthly mean — automated alerts enable teams to deploy emergency interventions like temporary shading or increase monitoring intensity before visual bleaching appears.
What This Enables
As a result, teams can target protective measures where they'll have greatest impact: shading shallow zones facing highest stress, relocating vulnerable corals to deeper refugia, or intensifying monitoring in areas predicted to bleach first. After heat events, the continuous record documents recovery trajectories and demonstrates whether restoration efforts are creating measurable thermal resilience[3] — the evidence needed to justify adaptive management decisions and secure continued conservation funding.
Customer Stories
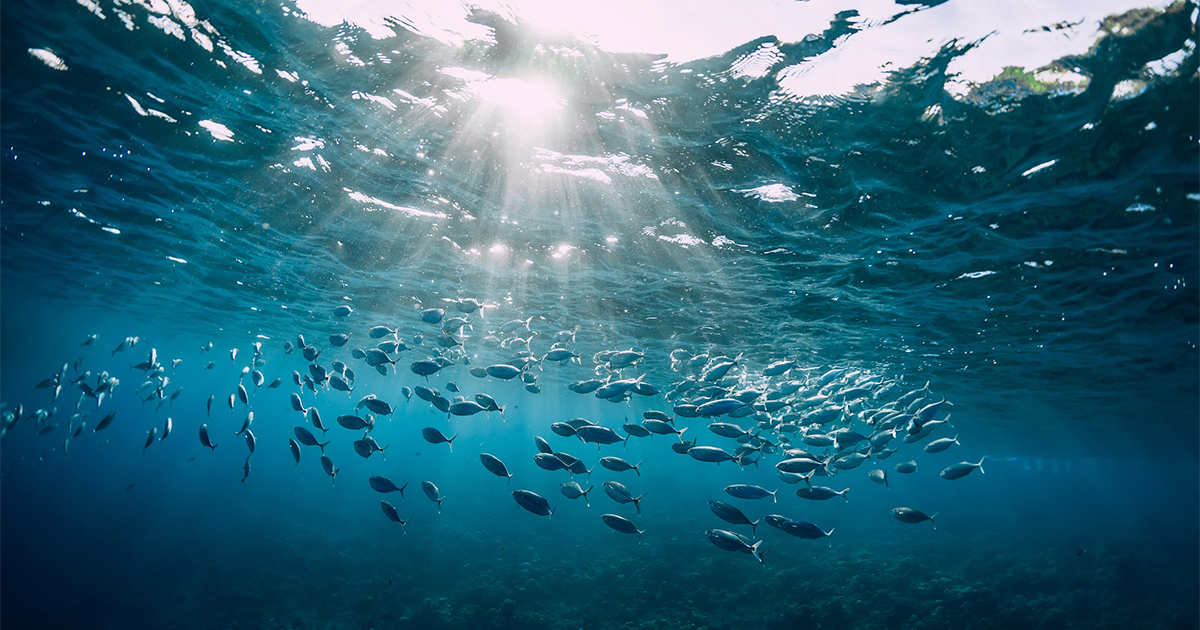
How researchers use the Spotter Platform to collect real-time data and protect the Poor Knights Islands
Ocean scientists, government, and coastal communities use data collected by Spotter to monitor and combat the effects of climate change on the Poor Knights Islands marine ecosystem.
See full example.avif)
%20(1).avif)
Recommended Systems (3)
The monitoring approach divides into complementary depth zones: shallow systems track the high-stress crest environment where bleaching typically initiates, while deeper systems identify potential thermal refugia. Multiple instances positioned across the reef's depth profile provide the vertical resolution needed to detect thermal stratification patterns.
System Overview
Purpose
Track thermal stress accumulation in shallow reef zones where bleaching risk is highest and intervention opportunities are greatest.
Deployment Context
Positioned on reef crest or shallow flat where corals experience maximum thermal exposure. Multiple instances across the shallow zone capture spatial variability in stress patterns.
Sensors
Required
Temperature
Measures continuous thermal stress accumulation for Degree Heating Week calculations and bleaching threshold detection.
Important
Dissolved Oxygen
Tracks metabolic stress as oxygen levels drop during heat events, indicating when corals shift from stressed to critically impaired.
pH
Detects acidification stress that compounds thermal impacts, since heat events often coincide with reduced pH conditions.
Nice-to-have
Turbidity
Reveals sediment resuspension from storms that can provide temporary shading relief during heat events or compound stress through smothering.
Use of this content is subject to Sofar's Terms of Use and Privacy Policy.