Continuous Water Level Monitoring for Local Tidal Model Refinement
Multi-point water level data across approach channels builds the historical record needed to calibrate local tidal models and reduce prediction errors that compress transit windows.
What You'll Achieve
Quantify Actual vs. Predicted Tide Deviation
Track how actual water levels differ from predictions at each channel location, revealing the site-specific correction factors that refine window planning.
Capture Spatial Variation Along Approach Channels
Document how water levels differ between outer approach and inner harbour, capturing channel geometry and distance effects that single tide gauges miss.
Correlate Environmental Drivers with Residual Tide
Link wind setup, barometric pressure, and freshwater discharge to prediction errors, enabling physics-based corrections during future events.
When Tidal Predictions Miss by Centimeters That Matter
Published tidal predictions provide a baseline, but actual water levels routinely deviate by 0.2–0.5 metres due to meteorological and hydrological forcing. Wind setup during sustained onshore conditions can add 0.3 metres or more[1]. Low barometric pressure raises water levels roughly 1 centimetre per millibar below normal[2]. River discharge following heavy rainfall alters channel levels for days. For pilots managing vessels with 1 metre UKC (Under-Keel Clearance) margins, these deviations are not noise—they determine whether a transit proceeds or waits.
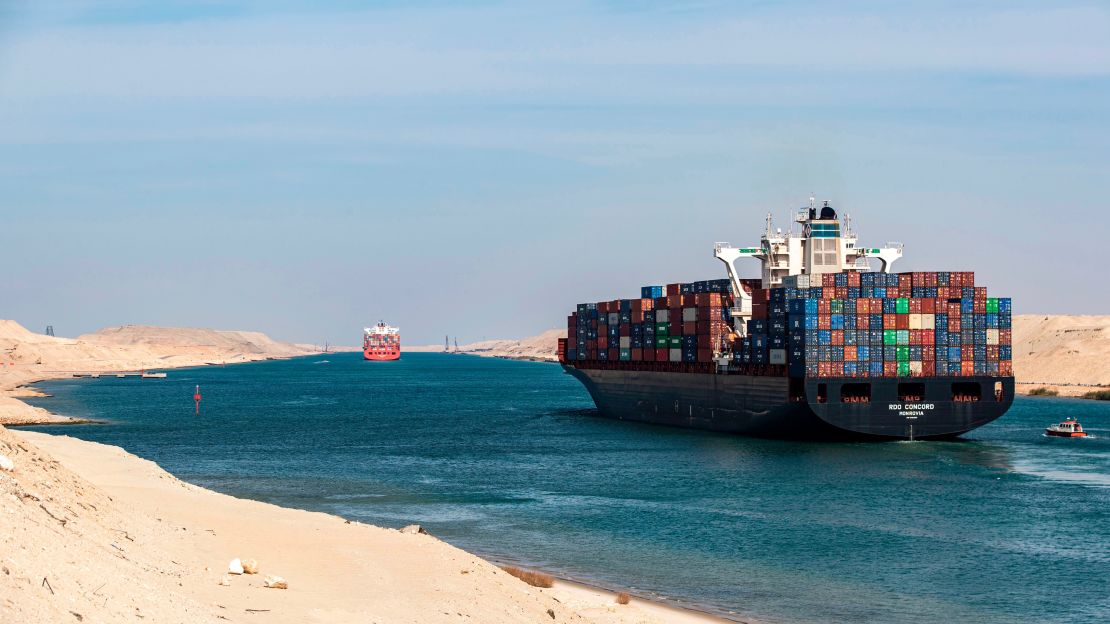
Most ports rely on a single tide gauge at the harbour entrance, but water levels vary along approach channels due to channel geometry, bottom friction, and distance from the open sea. A deep-draft vessel transiting 15 kilometres (9 miles) of dredged channel cannot assume the entrance gauge reflects conditions at the controlling depth 8 kilometres inland. Without continuous multi-point data, ports lack the historical record needed to calibrate local tidal models, understand spatial variation, and quantify how environmental drivers produce residual tide—the difference between prediction and reality.
Building the Dataset That Calibrates Local Predictions
What Gets Deployed
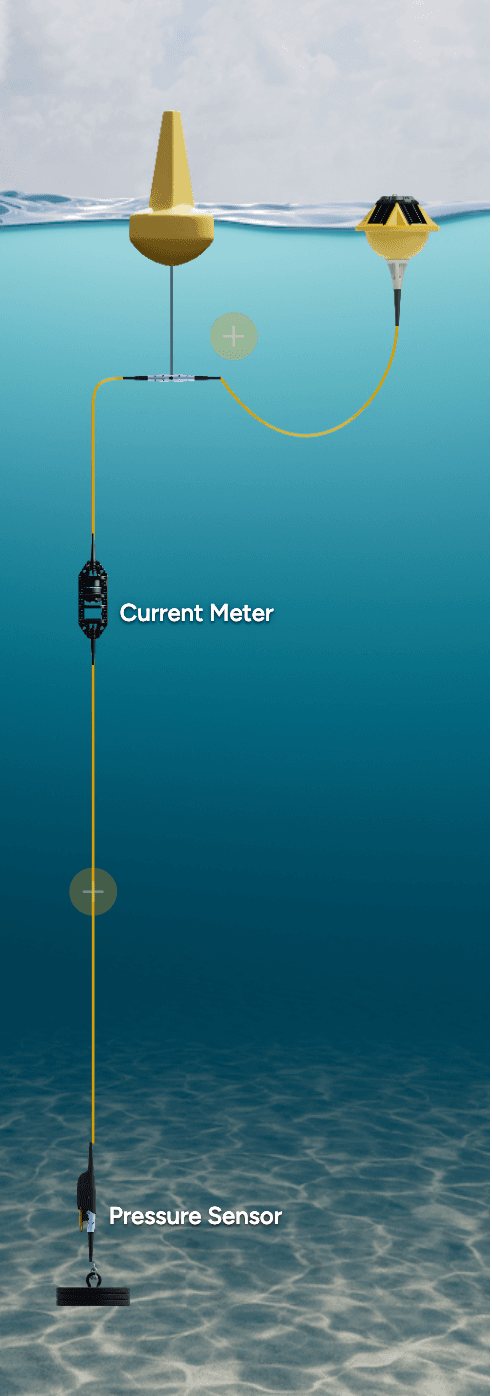
Addressing these prediction gaps requires pressure sensors at multiple positions along the approach channel, paired with meteorological instruments that capture the environmental drivers of residual tide. Referenced to local chart datum (LAT—Lowest Astronomical Tide), these sensors measure actual water levels continuously at sub-centimetre resolution, while co-located barometric sensors enable the atmospheric corrections essential for accuracy. Wind sensors at each position document the setup conditions that raise or lower levels beyond astronomical predictions.
What the Data Reveals
Because the network captures water levels continuously at multiple channel positions, patterns emerge that single-gauge monitoring cannot reveal. Over months, the data shows how the tidal wave propagates along the channel—when the outer approach reaches high water, conditions 10 kilometres inland may lag by 15–30 minutes. The record documents how channel geometry amplifies or dampens tidal range at different locations. When wind events occur, the dataset captures how setup develops differently at exposed versus sheltered positions. Correlation analysis links these observations to concurrent barometric pressure and wind data[3], building the empirical relationships that transform raw predictions into site-calibrated forecasts.
What This Enables
After one to two years of continuous data, port hydrographers can extract the harmonic constituents specific to each channel location[4]—refining the astronomical prediction baseline. More importantly, they quantify the residual tide response to environmental forcing: how much additional water a 20-knot onshore wind adds, how low pressure systems affect levels, how upstream rainfall propagates through the system. These calibrated relationships work alongside the live data stream from the same sensors. Real-time pressure readings at each channel position reveal the residual as it develops—the gap between predicted and actual water level—while concurrent barometric and wind data help anticipate how conditions will evolve. The result is tighter window calculations that expand safe transit opportunities without compromising UKC margins—because decisions draw on both calibrated models and real-time observations across the channel.
Recommended Systems (3)
Because tidal model improvement requires both temporal continuity and spatial coverage, the monitoring approach positions water level sensors at key channel locations while capturing the environmental drivers that cause prediction errors. The primary reference station establishes the benchmark record, while secondary stations document how conditions vary along the transit route. For channels exceeding 15 kilometres, additional positions may be needed to capture intermediate variation.
System Overview
Purpose
Establish the high-accuracy water level benchmark and meteorological reference for the approach channel, positioned at or near the existing tide gauge location for continuity with historical records. |
Deployment Context
Moored or piled structure at a representative channel location, typically near the harbour entrance where official predictions apply.
Sensors
Required
Pressure (Depth)
Provides continuous water level measurement referenced to chart datum, capturing actual tide height at sub-centimetre resolution for model calibration.
Pressure (Barometric)
Enables atmospheric pressure correction essential for isolating true water level change from barometric effects on pressure sensors.
Important
Wind
Documents wind speed and direction at the measurement location, enabling correlation between sustained wind events and observed water level setup.
Nice-to-have
Current Meter
Adds current velocity data that correlates with tidal phase and reveals how freshwater discharge affects the tidal signature during high-flow periods.
Sources
- [1]Wind setup during sustained onshore conditions can add 0.3 metres or more— Wikipedia
- [2]Low barometric pressure raises water levels roughly 1 centimetre per millibar below normal— Hawaii
- [3]A Framework to Simplify Astro‐Meteorological Water Level and Wind Inputs for Modeling Coastal Marsh Ecomorphodynamics— Doi
- [4]About Harmonic Constituents— NOAA
Use of this content is subject to Sofar's Terms of Use and Privacy Policy.