Wave Energy and Water Level Monitoring for Erosion Assessment
Continuous wave and water level records classify erosion-driving events against program thresholds, triggering post-event surveys and separating storm impacts from seasonal trends.
What You'll Achieve
Objective Event Classification for Survey Mobilization
Classify each storm against program wave energy thresholds so survey mobilization decisions rely on continuous records rather than subjective field calls.
Clear Separation of Storm Impact from Chronic Trend
Separate acute storm-driven shoreline change from chronic background erosion trends so management actions target the right cause with defensible evidence.
Datum-Consistent Records for Engineering and Funding Defensibility
Build a datum-tied wave and water level record that makes every shoreline survey comparable across years and defensible in engineering and funding reviews.
Ambiguous Shoreline Change Delays Protection Decisions
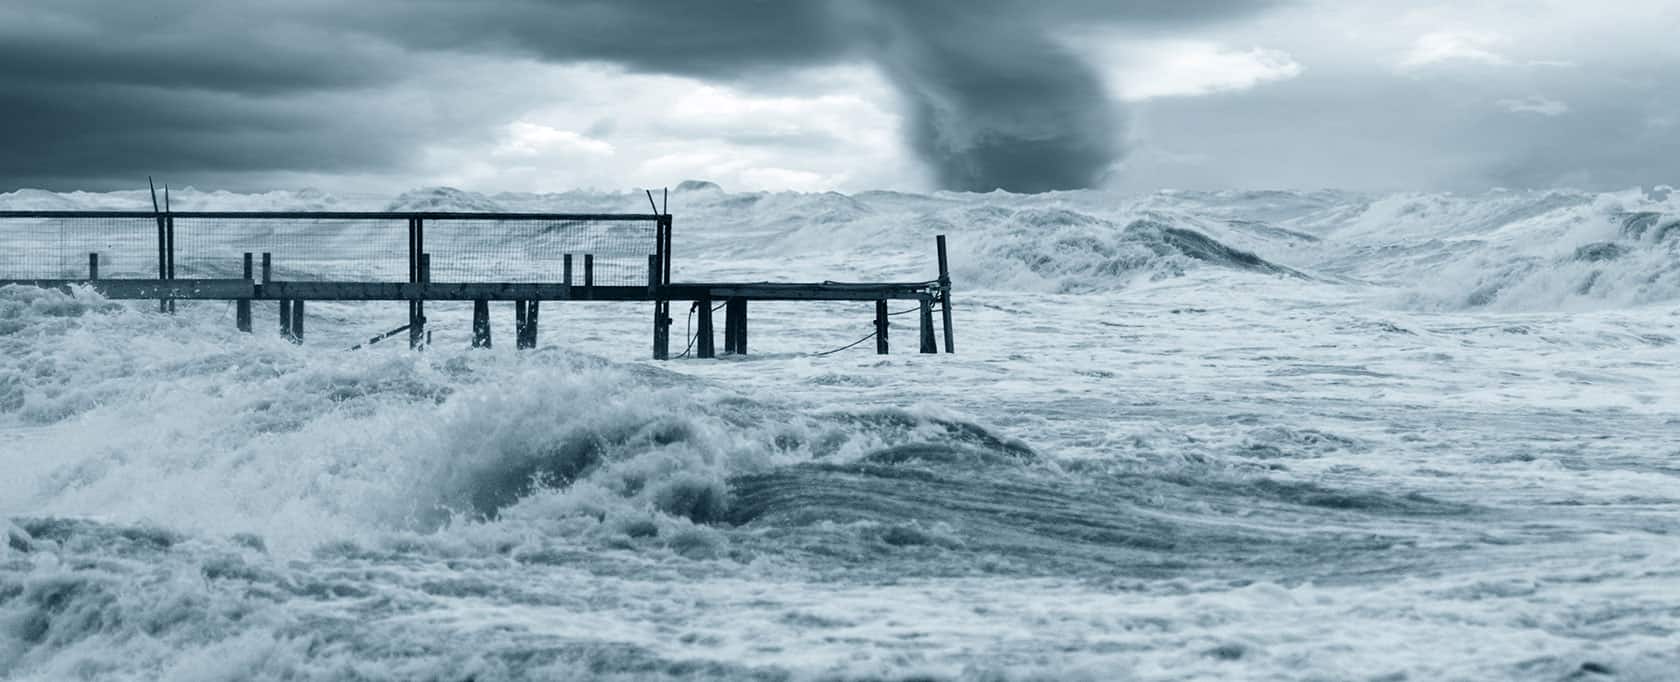
Eroding shorelines create a persistent classification problem. After a coastal storm, practitioners must decide whether observed change warrants a post-event survey or falls within normal seasonal variability. Without a continuous wave and water level record, every shift in shoreline position is ambiguous. That ambiguity cascades into delayed management decisions, from justifying emergency protection funding to setting timelines for managed realignment, the strategic relocation of development away from advancing hazards.
Periodic survey campaigns cannot reconstruct what happened between visits. Regional wave models and distant gauge stations, often spaced 500–1,000 km (300–600 miles) apart, leave local forcing conditions unresolved. Data-logging instruments that require boat visits to download compound the delay: by the time records are retrieved, the decision window for post-event response has closed. Shoreline surveys conducted without a consistent vertical datum tie introduce a separate failure mode[1]. Apparent change may be a datum artifact rather than real erosion, and that distinction matters in every engineering and funding conversation.
Continuous Wave and Water Level Records Turn Ambiguity into Actionable Event Classification
What Gets Deployed
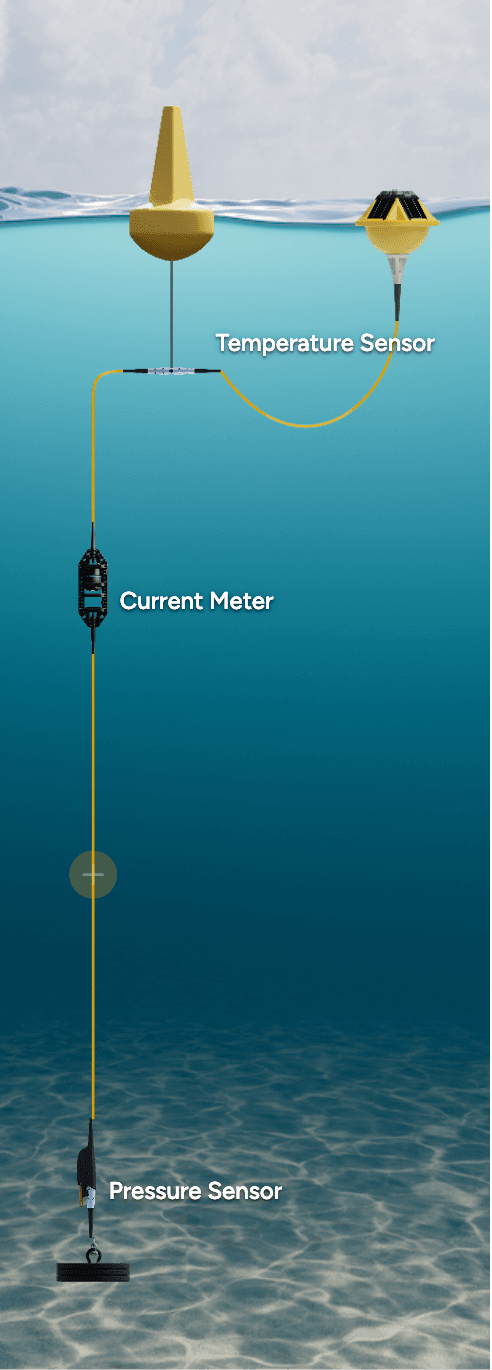
A nearshore wave buoy and water level station captures Hs (significant wave height) and water level continuously at the monitoring site, with real-time telemetry delivering data as conditions evolve rather than after a boat visit to retrieve logged records. The wave buoy records the energy reaching the shoreline, the direct forcing that drives erosion[2], while a datum-tied pressure sensor tracks water levels referenced to the project's control network. This pairing closes the specific gap that stalls decisions: every storm event now has a measured forcing signature, not an interpolated estimate from a distant gauge.
What the Data Reveals
Over months, the continuous Hs record builds a site-specific wave climate baseline. Teams define a program threshold, commonly around 2.5 m Hs, above which an event is classified as a trigger requiring post-event survey mobilization. Because this threshold is calibrated to local conditions and historical erosion response, it replaces subjective judgment with a documented decision rule. Events below the threshold are logged but do not trigger costly rapid-response surveys, saving mobilization resources for the storms that actually reshape the shoreline.
Water level data, tied to permanent benchmarks in the project's control network, adds a second classification dimension. When elevated water levels coincide with high wave energy, Total Water Level (TWL), the combination of storm tide and wave runup, determines how far inland wave forces penetrate. This record lets teams distinguish between events that merely reworked the foreshore within the depth of closure (the seaward limit of significant sediment exchange) and events that overtopped the berm or reached the dune toe, informing which shoreline proxy to prioritize in the post-event survey.
What This Enables
Across seasons and years, these records accumulate into a forcing history that separates chronic background erosion from acute event-driven change. A DoD (DEM of Difference), the subtracted surface between two topographic surveys, quantifies volume change by compartment. But only the forcing record explains why that change occurred. When teams present a DoD alongside the wave and water level time series, funding reviewers and engineers see the cause-and-effect chain linking a specific storm to a measured shoreline response. This evidence package transforms erosion documentation from ambiguous snapshots into a defensible narrative, one that supports engineering design, managed realignment planning, and the adaptation pathway decisions that follow.
Recommended Systems (2)
Because erosion assessment depends on matching measured wave forcing to observed shoreline response, the core monitoring platform is a nearshore station that captures wave energy and water level data for event classification and long-term baseline development. Where programs also need to document visible shoreline change between topographic surveys[3], a shore-based camera mounted on stable coastal infrastructure can complement the nearshore station by recording time-lapse imagery of shoreline position and morphological response. For monitoring reaches longer than approximately 2 km (1.2 miles), additional wave and water level positions may be needed to account for alongshore variability in exposure and shoreline orientation.
System Overview
Purpose
Captures continuous wave energy and water level data to classify erosion-driving events against program thresholds and build the long-term forcing baseline.
Deployment Context
Moored at the seaward edge of the monitoring reach, in water depths that capture representative wave conditions before significant shoaling transformation. Deployable from small vessels, keeping mobilization costs proportional to the monitoring task. Station position must be tied to the project's geodetic control network for datum continuity.
Sensors
Required
Wave
Measures Hs for event classification against program-specific storm thresholds, the primary metric triggering post-event survey mobilization.
Pressure (Depth)
Provides continuous datum-tied water level data essential for Total Water Level calculation and multi-year survey comparisons.
Important
Current Meter
Records longshore current direction and speed, characterizing net sediment transport pathways along the monitoring reach.
Wind
Captures local wind speed and direction to explain wave generation events and support regional wave model validation.
Use of this content is subject to Sofar's Terms of Use and Privacy Policy.