Real-Time Storm Surge Detection and Coastal Flood Warning
Distributed sensors capture every component of total water level, from surge and tide to wave runup, enabling threshold-based flood warnings and overtopping alerts.
What You'll Achieve
Threshold-Based Warnings From Measured Conditions
Issues flood warnings tied to measured total water level at the defense line, not extrapolated from regional gauges hundreds of kilometers away.
Early Compound Flooding Detection
Detects when storm surge blocks river drainage and triggers inland flood alerts during the critical window before stormwater backs up.
Datum-Referenced Event Records Through the Storm
Creates continuous, datum-corrected high-water records that survive the event, supporting disaster documentation and refining future flood models.
Total Water Level Gaps in Local Flood Warning
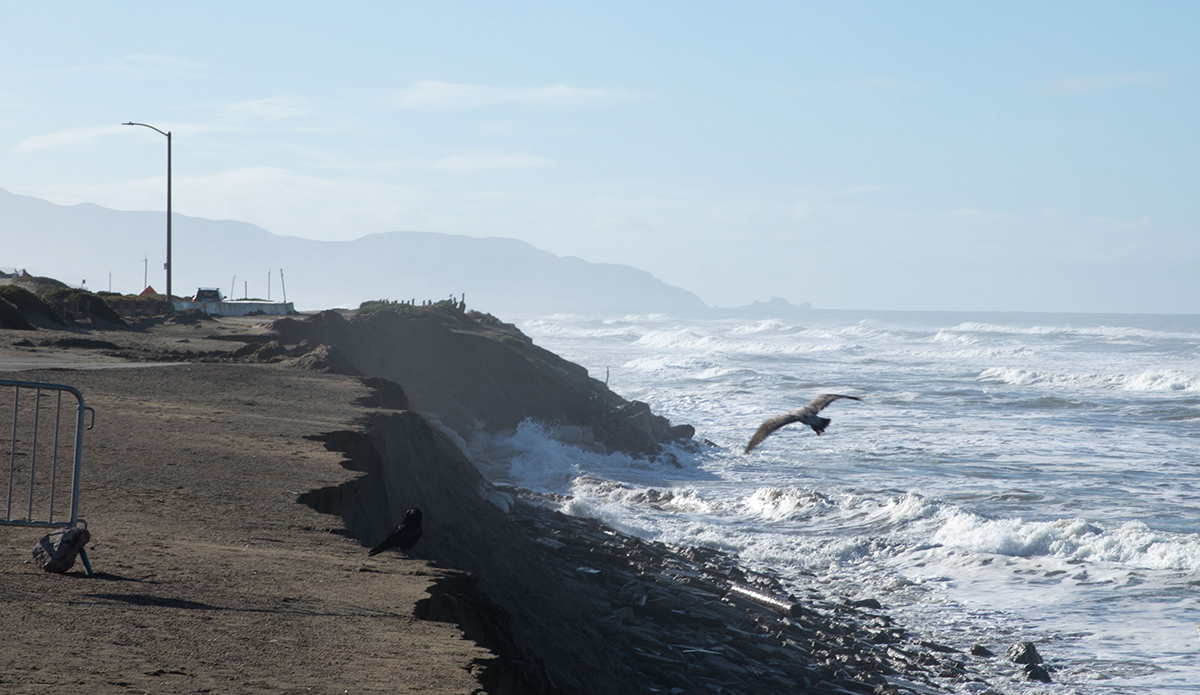
Coastal flood warnings fail when they treat storm surge as the only threat. The real hazard is TWL (Total Water Level): surge plus tide plus wave setup plus wave runup, all acting together[1]. A storm with modest surge can still overtop defenses if long-period waves drive runup higher than expected. Where estuaries are present, the problem compounds: surge blocks river drainage and traps stormwater inland, escalating risk beyond what either source would produce alone.
Regional tide gauge networks space stations hundreds of kilometers apart, far too sparse for neighborhood-scale flood decisions. Traditional data loggers require boat visits to retrieve readings, making them useless during the storms that matter most. Rapid pre-storm sensor installations that skip the benchmark tie produce water level readings without reliable datum correction, triggering false alarms or missing critical thresholds at the worst possible moment. Without real-time, multi-component data at the local scale, flood managers must extrapolate from distant gauges and hope regional models fill the gap.
Real-Time TWL Monitoring at the Defense Line
What Gets Deployed
A distributed sensor network anchors on the coastal defense line, with upstream stations added where estuarine conditions create compound flooding risk.
At the coastal defense, datum-corrected pressure sensors track storm tide, the combination of surge and predicted tide. Wave sensors capture both Hs (significant wave height) and wave period separately. This distinction matters because overtopping is wave-period-dependent: two storms producing identical 2-meter (6.6-foot) wave heights can generate vastly different overtopping volumes when one has an 8-second period and the other 14 seconds[2].
Wind and barometric pressure sensors complete the coastal picture, providing the atmospheric inputs that drive local surge setup. Where the coastline includes estuaries or tidal rivers, a second station monitors water levels referenced to the same vertical datum, so operators can compare coastal and inland readings directly. Real-time telemetry from all positions is non-negotiable. Data locked inside a logger during a storm is data that does not exist when decisions are most urgent.
What the Data Reveals
Because each TWL component arrives as a separate real-time stream, operators track which driver dominates as a storm approaches. During the event, the coastal station shows surge building against the predicted tide while wave height and period evolve independently. This separation makes it possible to calculate overtopping discharge (q) in real time rather than after the fact. Overtopping discharge is the volume of water flowing over a defense per meter of crest per second. When q approaches pedestrian hazard thresholds of roughly 0.03–0.1 liters per second per meter, teams close waterfront access well before conditions look visibly dangerous from shore.
Where an estuarine station is deployed, the compound flooding signal emerges when river levels climb even as the coastal surge holds water high at the mouth[3]. That roughly three-hour lag between peak surge and peak river discharge is the window where flood risk escalates beyond what either source would produce alone. Current meters detect the moment flow reverses, when surge-driven saltwater begins pushing upstream instead of allowing freshwater to drain seaward. A salinity spike confirms the reversal. These layered signals give emergency managers a compound flooding alert that arrives hours before stormwater backs up into streets and basements.
What This Enables
With freeboard (the vertical margin between water level and defense crest) updating continuously at the coastal station, flood managers escalate warnings in step with actual conditions rather than broad regional forecasts. Pump stations activate when measured water levels cross site-specific triggers. Road closures and evacuation orders reference real thresholds, not model extrapolations from a gauge 100 km (60 miles) away.
After the event passes, the continuous record provides datum-referenced high-water marks for every hour of the storm. These marks validate forecast models, support disaster assistance documentation, and strengthen the local dataset that informs AEP (Annual Exceedance Probability) analysis, the statistically correct way to express flood likelihood, replacing misleading terms like "100-year flood."
Over successive storm seasons, the accumulating record reveals whether residual risk (the risk remaining after defenses are in place) is growing as sea levels rise, giving decision-makers the evidence to justify adaptation investments before the next event arrives.
Case Study
Dropping Buoys Into Cyclones: How Queensland Monitors 7,000 km of Coastline
A small government team uses Spotter to maintain a coastal wave network and deploy buoys from light aircraft into the paths of approaching storms.
See full example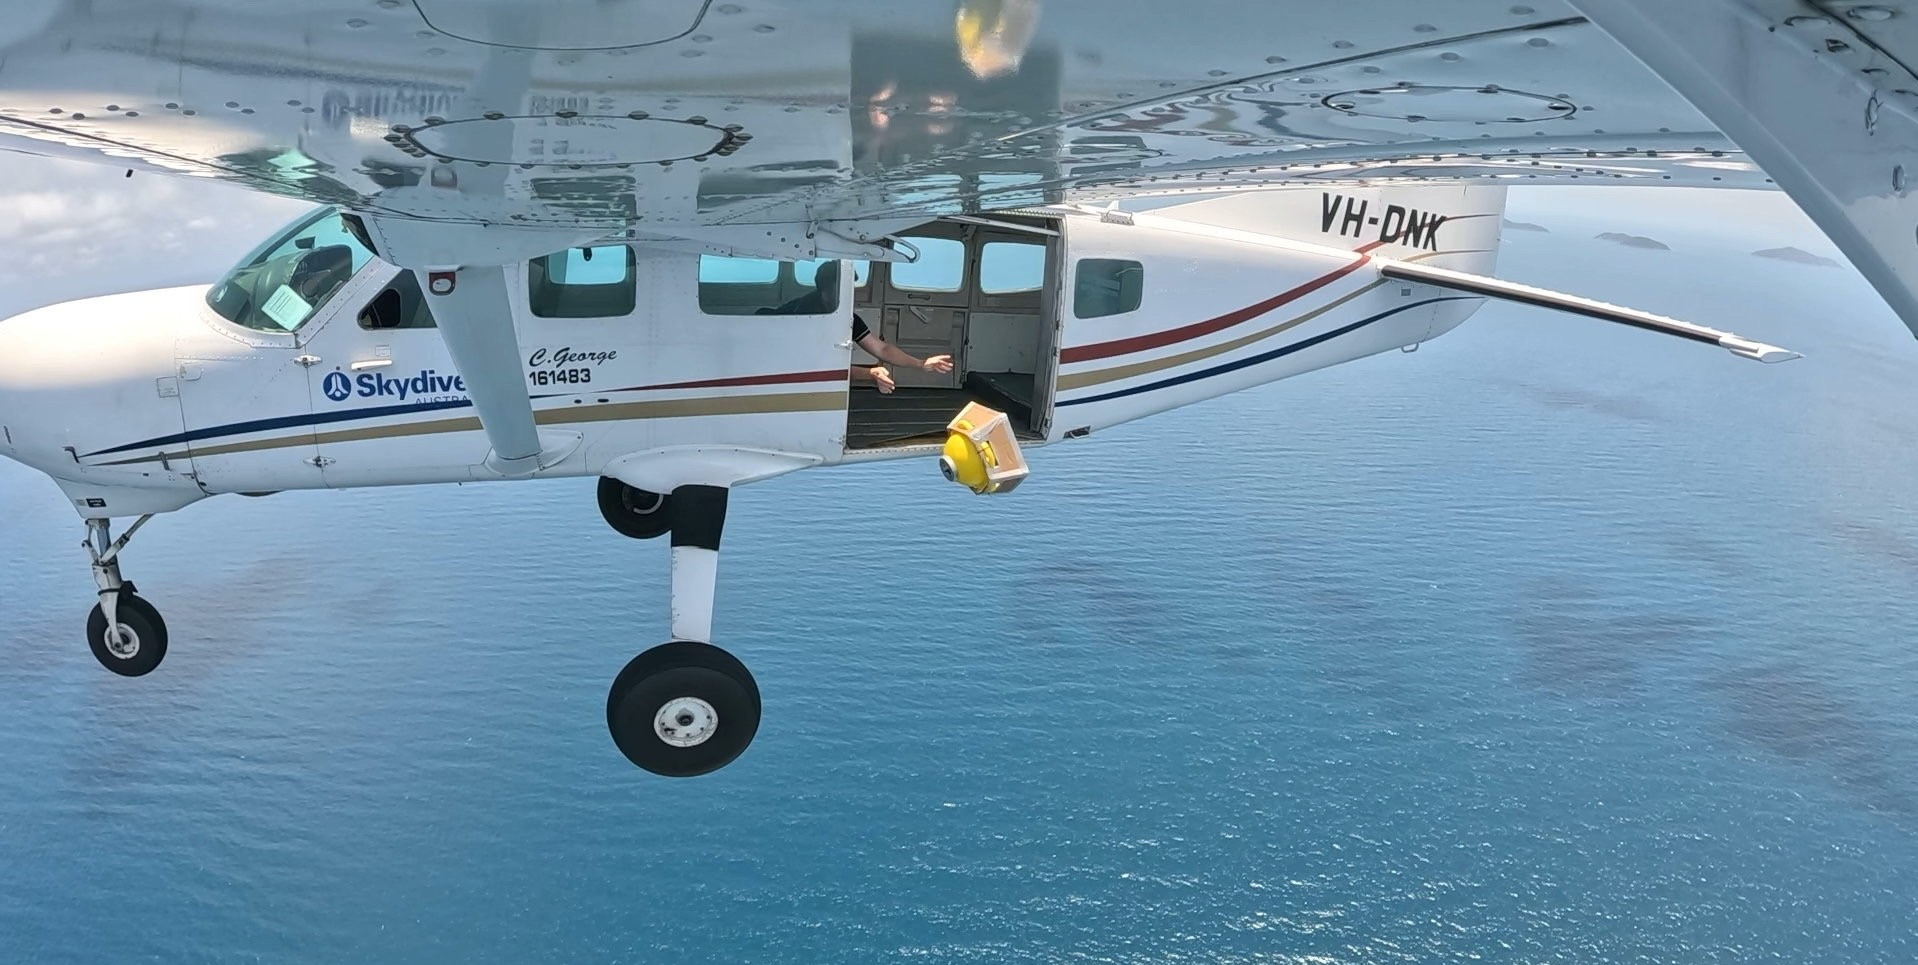
Recommended Systems (3)
Because TWL is composed of independent drivers, no single sensor position captures the full flood picture. The primary station sits at the coastal defense, measuring the oceanic forces that drive overtopping and seaward inundation. Where the coastline includes estuaries or tidal rivers, a second station tracks the inland conditions that create compound flooding. Both station types must operate autonomously through the storm and transmit in real time, since they are most valuable precisely when boat access is impossible. For coastlines with multiple defense segments or estuarine branches, additional positions may be needed to close spatial gaps.
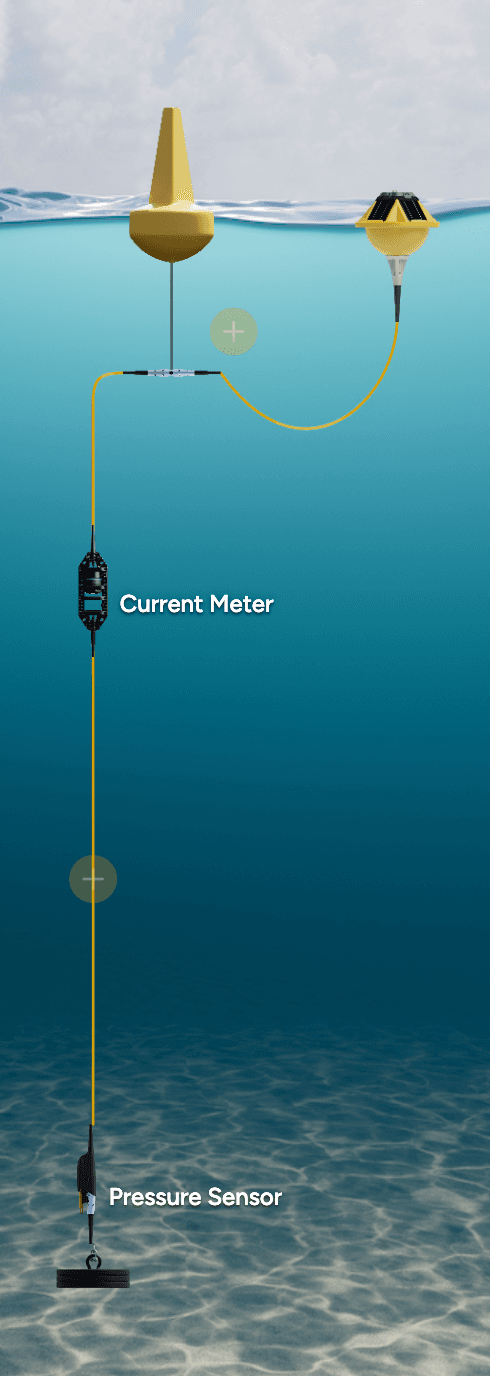
System Overview
Purpose
Measures storm tide, wave height, wave period, and wind to calculate total water level and overtopping risk at the primary coastal defense. |
Deployment Context
Positioned at the seaward edge of the flood-prone area, near the defense structure, where instruments capture open-coast wave conditions before breaking.
Sensors
Required
Pressure (Depth)
Measures water level referenced to local vertical datum, providing the foundation for storm tide tracking and real-time freeboard calculation.
Wave
Captures significant wave height and period independently. Both are essential because overtopping volume depends on period, not height alone.
Pressure (Barometric)
Provides atmospheric correction for water level readings — without it, pressure data drifts with passing weather systems.
Wind
Measures speed and direction driving local surge setup and wave generation, feeding real-time operational forecasts during the approach.
Sources
Use of this content is subject to Sofar's Terms of Use and Privacy Policy.